Trading Journal
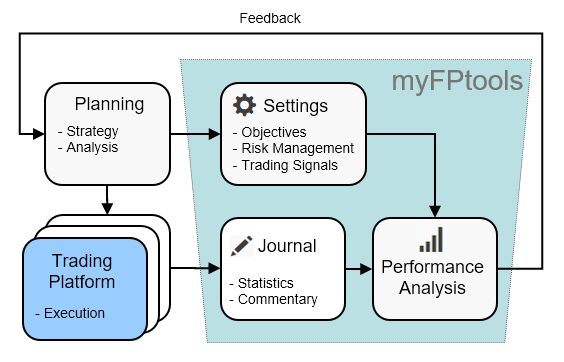
Recording a Trading Journal for each of your trades to capture the situation and reason for entering or exiting trades, will help you analyse and learn from your trading experience. The journal can include comments (perhaps recording your observations on the trade or market, or your state of mind or other environmental factors), optional fields (e.g. trade type and strategy) and trading signals which together tag your trades for performance analysis.
The purpose of analysing your performance is to generate feedback with specific recommendations for change to improve your trading strategy and capabilities. To enter your journal, you first add entry criteria to all your trades, then you add exit criteria for any trades that have been closed.
Trading Capabilities
Your trading capabilities can perhaps be classified in the following areas:
-
Analytical Skills e.g. Are you able to identify winning trades? Do you enter and exit trades at the optimum point? (Tip: start analysis with win/loss ratio, optimum trade and MFE)
-
Risk Management e.g. Do you enter trades with inappropriate risk? Do you exit too late and break money management rules? (Tip: start analysis with risk/reward, drawdown and MAE)
-
Trading Psychology e.g. Do you always cut your losses and let your winners run? Do you have the discipline to always execute your trading plan? (Tip: start analysis with profit/loss ratio)
Performance Analysis
Performance analysis will help identify aspects of your trading strategy and capabilities that are either successful (so keep doing) or unsuccessful (so stop or change). Using myFPtools, statistical analysis of closed trades is possible across a number of dimensions:
-
Standard order fields ensure that all trades have statistics such as profit/loss, win/loss ratio, profit/loss ratio, drawdown, by market, by account, and by time frame (between specific dates, duration of trade, opening time of day, opening day of week).
-
Using Contract Profile fields gives you the option to analyse by region, sector, and ticker.
-
Using all Trading Journal fields allows analysis by risk level, risk/reward, trade type, market trend, strategy, entry criteria, exit criteria, MFE, MAE, and optimum trade. Defining custom strategies and trading signals gives you considerable flexibility as to how you tag your trades for performance analysis.
Given the numerous options and various additional data fields that can be collected for each trade. We recommended an iterative and staged approach to analysing closed trades, based on collecting the minimum amount of data to start with, and then tailoring your trading journal based on the areas that need more focus (to find the root cause). Traffic lighting is always used to help you identify the areas and capabilities to focus on, whether your analytical skills, risk management or trading psychology.
Trading Signals
Trading signals are probably the most flexible of the tagging methods for trades. You can define as many signals as you wish, and attach multiple signals to each trade. The signals are so flexible that you may wish to use them as an alternative to the Trade Type, Market Trend and Strategy fields (as such these fields may be enabled or disable through the journal settings).
Signals may be chart patterns, candlesticks, price/volume indicators, time cycles, sentiment indicators or unrelated to technical analysis (e.g. roll over, profit taking, stop/loss order, limit order). Signals are attached to trades as both 'Entry Criteria' (the reasons for entering a trade) and 'Exit Criteria' (the reasons for closing a trade). Tagging your trades with these signals is not only a useful record, but also allows you to do performance analysis by filtering the trades based on which individual or multiple signals were attached to trades.
By default signals are attached to orders as tags. If you enable scoring then each signal will be given a weighting and when you attach the signal to an order you will rate the quality, such that the combination of the Weighting x Quality gives you a score for entry and exit signals on a trade. If you enable the 'With Scoring' option, each signal defined in your journal settings can have a weighting attached. When you attach a signal to a trade, you can rate the quality of the signal or allow the system to default a value based on the chart interval used for the signal, and the trade type.
Market Trend & Strategy Fields
If you are using the journal options to record both Market Trend and Strategy for trades, the following examples are intended to show how they are might be combined.
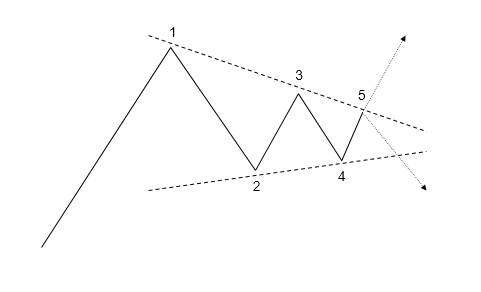
The first pattern shows a bull market entering a consolidation phase (the chart pattern is a symmetrical triangle). The point at which you identify that the trend has entered a consolidation phase is subjective (e.g. point 3 would be early, point 5 late):
| Point | Trade | Market Trend | Strategy |
|---|---|---|---|
| 1 | Sell | Bull | Reversal |
| 2 | Buy | Bull | Pullback |
| 3 | Sell | Bull or Bull Consolidation | Reversal |
| 4 | Buy | Bull Consolidation | Pullback |
| 5 | Buy | Bull Consolidation | Continuation |
| 5 | Sell | Bull Consolidation | Reversal |
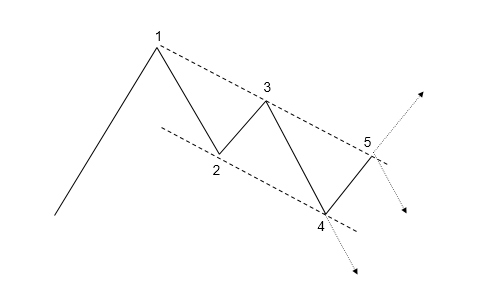
The second pattern shows a bull market entering a correction. When there is a secondary trend such as a 'Correction' the strategy should relate to the secondary trend. You will see that the 'Buy' strategy at point 4* depends on whether you have identified the down wave as a 'Correction' or just a pullback:
| Point | Trade | Market Trend | Strategy |
|---|---|---|---|
| 1 | Sell | Bull | Reversal |
| 2 | Buy | Bull | Pullback |
| 3 | Sell | Bull | Reversal |
| 4* | Buy | Bull | Pullback |
| 4* | Buy | Bull Correction | Reversal |
| 4 | Sell | Bull Correction | Continuation |
| 5 | Sell | Bull Correction | Pullback |